Subset SWOT LR L3 Unsmoothed data
This notebooks explains how to retrieve a geographical subset of unsmoothed (250-m) SWOT LR L3 data using altimetry_downloader_aviso.
Tutorial Objectives
Subset Swot data with cycle/passes numbers, and a geographical area selection, using
altimetry_downloader_avisoOpen data using
altimetry.ioVisualise data using
matplotlib
Note
Required environment to run this notebook:
altimetry_downloader_aviso: see documentation.altimetry.io: available here.matplotlib<3.11+cartopy
Import + code
import altimetry_downloader_aviso as dl_aviso
from altimetry.io import AltimetryData, FileCollectionSource
from pathlib import Path
import cartopy.crs as ccrs
import matplotlib.pyplot as plt
import logging
logging.basicConfig(level=logging.INFO)
Parameters
Define the variables you want:
variables = ['longitude', 'latitude', 'time', 'sigma0', 'ssha_unfiltered', 'quality_flag']
Define output folder to save results:
output_dir= Path.home() / "TMP_DATA" / "subsets"
Define the parameters needed to retrieve data:
geographical area
phase: 1day-orbit (Calval) / 21day-orbit (Science)
cycle min, max
list of half-orbits
# Mediterranean sea
box = (-15, 25, 40, 50)

cycles = [10, 12]

half_orbits = [1, 3, 14]
Download data using altimetry_downloader_aviso
dl_aviso.subset(
    'SWOT_L3_LR_SSH_Unsmoothed',
    output_dir=output_dir,
    cycle_number=cycles,
    pass_number=half_orbits,
    selected_variables=variables,
    box=box
)
INFO:altimetry_downloader_aviso.catalog_client.client:Fetching products from Aviso's catalog...
INFO:altimetry_downloader_aviso.catalog_client.granule_discoverer:Filtering SWOT_L3_LR_SSH_Unsmoothed product with filters {'cycle_number': [10, 12], 'pass_number': [1, 3, 14]}...
INFO:altimetry_downloader_aviso.core:Subsetting 6 file(s)...
['/home/atonneau/TMP_DATA/subsets/SWOT_L3_LR_SSH_Unsmoothed_010_001_20240125T001932_20240125T011059_v3.0.nc',
 '/home/atonneau/TMP_DATA/subsets/SWOT_L3_LR_SSH_Unsmoothed_010_003_20240125T020226_20240125T025352_v3.0.nc',
 '/home/atonneau/TMP_DATA/subsets/SWOT_L3_LR_SSH_Unsmoothed_010_014_20240125T112821_20240125T121947_v3.0.nc',
 '/home/atonneau/TMP_DATA/subsets/SWOT_L3_LR_SSH_Unsmoothed_012_001_20240306T174941_20240306T184108_v3.0.nc',
 '/home/atonneau/TMP_DATA/subsets/SWOT_L3_LR_SSH_Unsmoothed_012_003_20240306T193234_20240306T202401_v3.0.nc',
 '/home/atonneau/TMP_DATA/subsets/SWOT_L3_LR_SSH_Unsmoothed_012_014_20240307T045830_20240307T054956_v3.0.nc']
Open data using altimetry.io
Open data source
alti_data = AltimetryData(
    source=FileCollectionSource(
        path=output_dir,
        ftype="SWOT_L3_LR_SSH",
        subset="Unsmoothed",
    ),
)
Query data
ds = alti_data.query_orbit(
    cycle_number=10,
    pass_number=1,
    variables=variables,
)
ds
INFO:fcollections.core._filesdb:Picked subset {'version': '3.0', 'subset': <ProductSubset.Unsmoothed: 4>}
INFO:fcollections.core._readers:Files to read: 1
<xarray.Dataset>
Dimensions:          (num_lines: 12184, num_pixels: 519)
Coordinates:
    longitude        (num_lines, num_pixels) float64 dask.array<chunksize=(12184, 519), meta=np.ndarray>
    latitude         (num_lines, num_pixels) float64 dask.array<chunksize=(12184, 519), meta=np.ndarray>
    time             (num_lines) datetime64[ns] dask.array<chunksize=(12184,), meta=np.ndarray>
Dimensions without coordinates: num_lines, num_pixels
Data variables:
    sigma0           (num_lines, num_pixels) float64 dask.array<chunksize=(12184, 519), meta=np.ndarray>
    ssha_unfiltered  (num_lines, num_pixels) float64 dask.array<chunksize=(12184, 519), meta=np.ndarray>
    quality_flag     (num_lines, num_pixels) uint8 dask.array<chunksize=(12184, 519), meta=np.ndarray>
    cycle_number     (num_lines) uint8 10 10 10 10 10 10 ... 10 10 10 10 10 10
    pass_number      (num_lines) uint8 1 1 1 1 1 1 1 1 1 1 ... 1 1 1 1 1 1 1 1 1
Attributes: (12/43)
    Conventions:                     CF-1.9
    Metadata_Conventions:            Unidata Dataset Discovery v1.0
    cdm_data_type:                   Swath
    comment:                         Sea Surface Height measured by Altimetry
    geospatial_lat_units:            degrees_north
    geospatial_lon_units:            degrees_east
    ...                              ...
    geospatial_lon_max:              359.999999
    date_modified:                   2026-08-13T20:23:55Z
    history:                         2026-08-13T20:23:55Z: Created by DUACS K...
    date_created:                    2026-08-13T20:23:55Z
    date_issued:                     2026-08-13T20:23:55Z
temporality: reprocVisualize data
Apply quality flag on Sigma 0
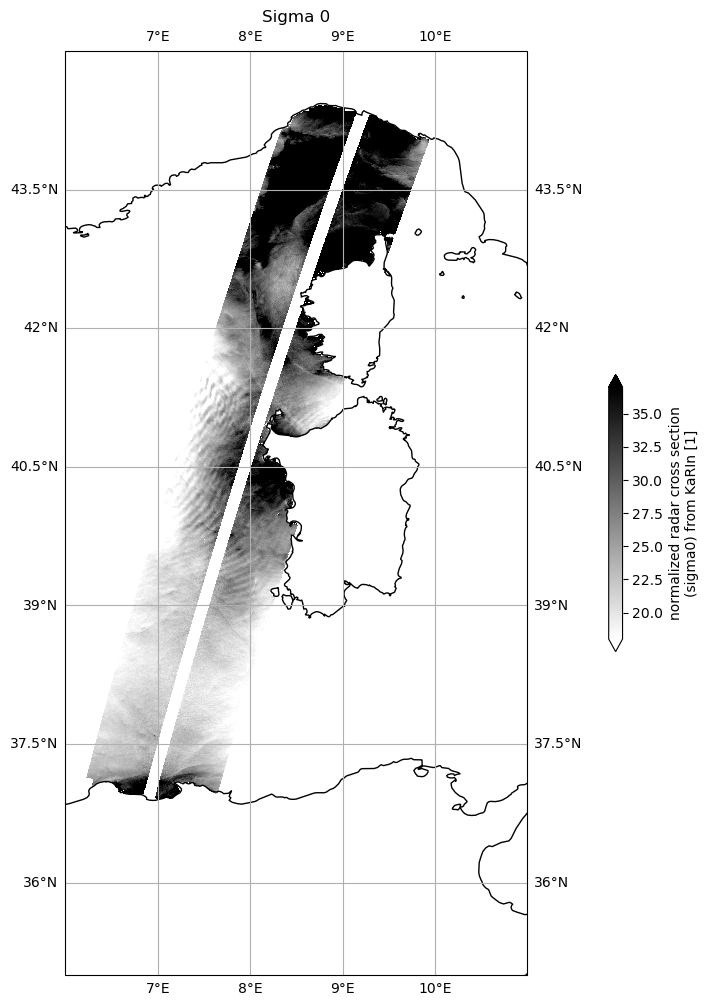
ds["sigma0"] = ds.sigma0.where(ds.quality_flag==0)
plot_kwargs = dict(
    x="longitude",
    y="latitude",
    cmap="gray_r",
    vmin=18,
    vmax=37,
)

fig, ax = plt.subplots(figsize=(21, 12), subplot_kw=dict(projection=ccrs.PlateCarree()))

ds.sigma0.plot.pcolormesh(ax=ax, cbar_kwargs={"shrink": 0.3}, **plot_kwargs)
plt.title("Sigma 0")

ax.gridlines(draw_labels=True)
ax.coastlines()
ax.set_extent([6, 11, 35, 45], crs=ccrs.PlateCarree())
plot_kwargs = dict(
    x="longitude",
    y="latitude",
    vmin=0,
    vmax=0.2,
)

fig, ax = plt.subplots(figsize=(21, 12), subplot_kw=dict(projection=ccrs.PlateCarree()))

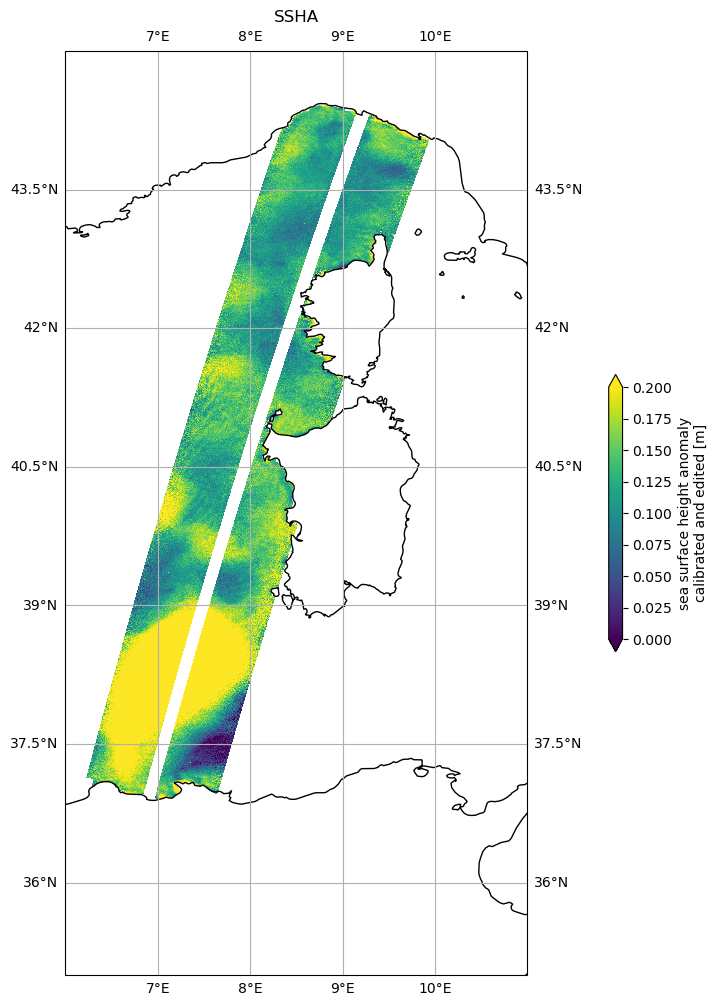
ds.ssha_unfiltered.plot.pcolormesh(ax=ax, cbar_kwargs={"shrink": 0.3}, **plot_kwargs)
plt.title('SSHA')

ax.gridlines(draw_labels=True)
ax.coastlines()
ax.set_extent([6, 11, 35, 45], crs=ccrs.PlateCarree())