Copyright CNES
Read and plot a SWOT-HR River Single Pass Reach product
In this notebook, we show how to read the SWOT-HR River Single Pass Reach vector product with geopandas and how to represent a variable
Libraries
import geopandas as gpd
import os
import numpy as np
import matplotlib.pyplot as plt
%matplotlib inline
1. Read a SWOT-HR River Single Pass Reach product
Note this is an extraction of the original file for demonstration purpose. It does not contain all variables and geometries
dir_swot = "../docs/data/swot"
file_swot_reach = os.path.join(
    dir_swot,
    "SWOT_L2_HR_RiverSP_Reach",
    "SWOT_L2_HR_RiverSP_Reach_015_033_SA_20240509T114031_20240509T114037_PIC0_01_extract.shp"
)
# read data with geopandas
gdf = gpd.read_file(file_swot_reach)
gdf.head()
| reach_id | time | time_tai | time_str | p_lat | p_lon | river_name | wse | wse_u | wse_r_u | ... | p_wid_var | p_n_nodes | p_dist_out | p_length | p_maf | p_dam_id | p_n_ch_max | p_n_ch_mod | p_low_slp | geometry | |
|---|---|---|---|---|---|---|---|---|---|---|---|---|---|---|---|---|---|---|---|---|---|
| 0 | 61670400011 | -1.000000e+12 | -1.000000e+12 | no_data | 5.043291 | -53.048925 | no_data | -1.000000e+12 | -1.000000e+12 | -1.000000e+12 | ... | 147791.751 | 3 | 89423.928 | 573.504801 | -1.000000e+12 | 0 | 7 | 4 | 0 | LINESTRING (-53.05135 5.04175, -53.05108 5.041... |
| 1 | 61670400023 | -1.000000e+12 | -1.000000e+12 | no_data | 5.041275 | -53.040153 | no_data | -1.000000e+12 | -1.000000e+12 | -1.000000e+12 | ... | 424227.915 | 9 | 91235.322 | 1811.393816 | -1.000000e+12 | 0 | 10 | 2 | 0 | LINESTRING (-53.04677 5.04475, -53.04650 5.044... |
| 2 | 61670400033 | 7.685711e+08 | 7.685711e+08 | 2024-05-09T11:58:10Z | 4.993706 | -53.027740 | Le Sinnamary | 2.958180e+01 | 7.493220e+00 | 7.492680e+00 | ... | 2309349.443 | 50 | 88707.431 | 10027.236715 | -1.000000e+12 | 0 | 22 | 4 | 0 | LINESTRING (-53.03375 5.03546, -53.03402 5.035... |
| 3 | 61670400043 | 7.685711e+08 | 7.685711e+08 | 2024-05-09T11:58:10Z | 4.921612 | -53.016789 | Le Sinnamary | 3.064150e+01 | 1.184000e-01 | 7.693000e-02 | ... | 4345107.297 | 39 | 96581.984 | 7874.552208 | -1.000000e+12 | 0 | 33 | 8 | 0 | LINESTRING (-53.03404 4.95192, -53.03431 4.951... |
| 4 | 61670400053 | -1.000000e+12 | -1.000000e+12 | no_data | 4.955817 | -53.042433 | no_data | -1.000000e+12 | -1.000000e+12 | -1.000000e+12 | ... | 482433.597 | 10 | 98607.588 | 2025.604217 | -1.000000e+12 | 0 | 9 | 2 | 0 | LINESTRING (-53.05083 4.96087, -53.05056 4.960... |
5 rows × 127 columns
Not a number values are loaded as floats, it is safer to replace them by actual NaN
fill_value = gdf.wse.min()
gdf.replace(fill_value, np.nan, inplace=True)
gdf.head()
| reach_id | time | time_tai | time_str | p_lat | p_lon | river_name | wse | wse_u | wse_r_u | ... | p_wid_var | p_n_nodes | p_dist_out | p_length | p_maf | p_dam_id | p_n_ch_max | p_n_ch_mod | p_low_slp | geometry | |
|---|---|---|---|---|---|---|---|---|---|---|---|---|---|---|---|---|---|---|---|---|---|
| 0 | 61670400011 | NaN | NaN | no_data | 5.043291 | -53.048925 | no_data | NaN | NaN | NaN | ... | 147791.751 | 3 | 89423.928 | 573.504801 | NaN | 0 | 7 | 4 | 0 | LINESTRING (-53.05135 5.04175, -53.05108 5.041... |
| 1 | 61670400023 | NaN | NaN | no_data | 5.041275 | -53.040153 | no_data | NaN | NaN | NaN | ... | 424227.915 | 9 | 91235.322 | 1811.393816 | NaN | 0 | 10 | 2 | 0 | LINESTRING (-53.04677 5.04475, -53.04650 5.044... |
| 2 | 61670400033 | 7.685711e+08 | 7.685711e+08 | 2024-05-09T11:58:10Z | 4.993706 | -53.027740 | Le Sinnamary | 29.5818 | 7.49322 | 7.49268 | ... | 2309349.443 | 50 | 88707.431 | 10027.236715 | NaN | 0 | 22 | 4 | 0 | LINESTRING (-53.03375 5.03546, -53.03402 5.035... |
| 3 | 61670400043 | 7.685711e+08 | 7.685711e+08 | 2024-05-09T11:58:10Z | 4.921612 | -53.016789 | Le Sinnamary | 30.6415 | 0.11840 | 0.07693 | ... | 4345107.297 | 39 | 96581.984 | 7874.552208 | NaN | 0 | 33 | 8 | 0 | LINESTRING (-53.03404 4.95192, -53.03431 4.951... |
| 4 | 61670400053 | NaN | NaN | no_data | 4.955817 | -53.042433 | no_data | NaN | NaN | NaN | ... | 482433.597 | 10 | 98607.588 | 2025.604217 | NaN | 0 | 9 | 2 | 0 | LINESTRING (-53.05083 4.96087, -53.05056 4.960... |
5 rows × 127 columns
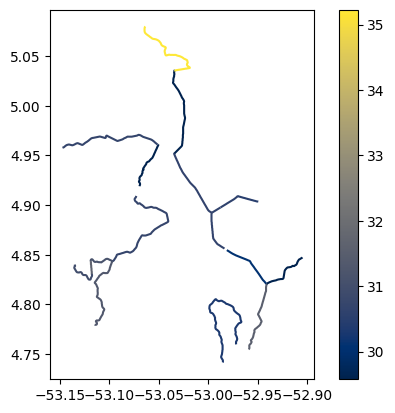
3. Plot data on maps
The most straightforward is to use native geopandas methods. Check out geopandas documentation for more options: https://geopandas.org/en/v0.9.0/docs/user_guide/mapping.html
fig, ax = plt.subplots(1, 1)
gdf.plot('wse', ax=ax, legend=True, cmap='cividis')
<Axes: >