Copyright CNES
Read and plot a SWOT-HR River Single Pass Node product
In this notebook, we show how to read the SWOT-HR River Single Pass Node vector product with geopandas and how to represent a variable
Libraries
import geopandas as gpd
import os
import numpy as np
import matplotlib.pyplot as plt
%matplotlib inline
1. Read a SWOT-HR River Single Pass Node product
Note this is an extraction of the original file for demonstration purpose. It does not contain all variables and geometries
dir_swot = "../docs/data/swot"
file_swot_reach = os.path.join(
    dir_swot,
    "SWOT_L2_HR_RiverSP_Node",
    "SWOT_L2_HR_RiverSP_Node_015_033_SA_20240509T114031_20240509T114037_PIC0_01_extract.shp"
)
# read data with geopandas
gdf = gpd.read_file(file_swot_reach)
gdf.head()
| reach_id | node_id | time | time_tai | time_str | lat | lon | lat_u | lon_u | river_name | ... | p_wse | p_wse_var | p_width | p_wid_var | p_dist_out | p_length | p_dam_id | p_n_ch_max | p_n_ch_mod | geometry | |
|---|---|---|---|---|---|---|---|---|---|---|---|---|---|---|---|---|---|---|---|---|---|
| 0 | 61670400011 | 61670400010021 | 7.685711e+08 | 7.685711e+08 | 2024-05-09T11:58:10Z | -1.000000e+12 | -1.000000e+12 | -1.000000e+12 | -1.000000e+12 | no_data | ... | 26.30 | 0.903124 | 1346.5 | 43841.889 | 89060.0 | 209.914761 | 0 | 6 | 4 | POINT (-53.05041 5.04232) |
| 1 | 61670400011 | 61670400010031 | 7.685711e+08 | 7.685711e+08 | 2024-05-09T11:58:10Z | -1.000000e+12 | -1.000000e+12 | -1.000000e+12 | -1.000000e+12 | no_data | ... | 28.85 | 1.560599 | 1113.0 | 8111.040 | 89242.0 | 181.795020 | 0 | 6 | 6 | POINT (-53.04892 5.04327) |
| 2 | 61670400011 | 61670400010041 | 7.685711e+08 | 7.685711e+08 | 2024-05-09T11:58:10Z | -1.000000e+12 | -1.000000e+12 | -1.000000e+12 | -1.000000e+12 | no_data | ... | 28.85 | 4.334997 | 1251.5 | 274635.139 | 89423.0 | 181.795020 | 0 | 7 | 4 | POINT (-53.04744 5.04427) |
| 3 | 61670400023 | 61670400020013 | 7.685711e+08 | 7.685711e+08 | 2024-05-09T11:58:10Z | -1.000000e+12 | -1.000000e+12 | -1.000000e+12 | -1.000000e+12 | no_data | ... | 31.40 | 0.000000 | 1790.0 | 80519.222 | 89631.0 | 207.997647 | 0 | 7 | 6 | POINT (-53.04582 5.04538) |
| 4 | 61670400023 | 61670400020023 | 7.685711e+08 | 7.685711e+08 | 2024-05-09T11:58:10Z | -1.000000e+12 | -1.000000e+12 | -1.000000e+12 | -1.000000e+12 | no_data | ... | 31.40 | 0.000000 | 1633.0 | 12914.640 | 89828.0 | 196.101754 | 0 | 6 | 5 | POINT (-53.04433 5.04494) |
5 rows × 53 columns
Not a number values are loaded as floats, it is safer to replace them by actual NaN
fill_value = gdf.lat.min()
gdf.replace(fill_value, np.nan, inplace=True)
gdf.head()
| reach_id | node_id | time | time_tai | time_str | lat | lon | lat_u | lon_u | river_name | ... | p_wse | p_wse_var | p_width | p_wid_var | p_dist_out | p_length | p_dam_id | p_n_ch_max | p_n_ch_mod | geometry | |
|---|---|---|---|---|---|---|---|---|---|---|---|---|---|---|---|---|---|---|---|---|---|
| 0 | 61670400011 | 61670400010021 | 7.685711e+08 | 7.685711e+08 | 2024-05-09T11:58:10Z | NaN | NaN | NaN | NaN | no_data | ... | 26.30 | 0.903124 | 1346.5 | 43841.889 | 89060.0 | 209.914761 | 0 | 6 | 4 | POINT (-53.05041 5.04232) |
| 1 | 61670400011 | 61670400010031 | 7.685711e+08 | 7.685711e+08 | 2024-05-09T11:58:10Z | NaN | NaN | NaN | NaN | no_data | ... | 28.85 | 1.560599 | 1113.0 | 8111.040 | 89242.0 | 181.795020 | 0 | 6 | 6 | POINT (-53.04892 5.04327) |
| 2 | 61670400011 | 61670400010041 | 7.685711e+08 | 7.685711e+08 | 2024-05-09T11:58:10Z | NaN | NaN | NaN | NaN | no_data | ... | 28.85 | 4.334997 | 1251.5 | 274635.139 | 89423.0 | 181.795020 | 0 | 7 | 4 | POINT (-53.04744 5.04427) |
| 3 | 61670400023 | 61670400020013 | 7.685711e+08 | 7.685711e+08 | 2024-05-09T11:58:10Z | NaN | NaN | NaN | NaN | no_data | ... | 31.40 | 0.000000 | 1790.0 | 80519.222 | 89631.0 | 207.997647 | 0 | 7 | 6 | POINT (-53.04582 5.04538) |
| 4 | 61670400023 | 61670400020023 | 7.685711e+08 | 7.685711e+08 | 2024-05-09T11:58:10Z | NaN | NaN | NaN | NaN | no_data | ... | 31.40 | 0.000000 | 1633.0 | 12914.640 | 89828.0 | 196.101754 | 0 | 6 | 5 | POINT (-53.04433 5.04494) |
5 rows × 53 columns
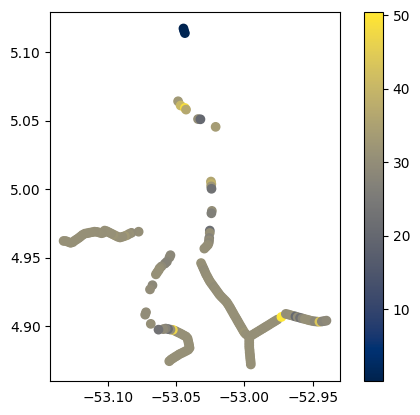
3. Plot data on maps
The most straightforward is to use native geopandas methods. Check out geopandas documentation for more options: https://geopandas.org/en/v0.9.0/docs/user_guide/mapping.html
fig, ax = plt.subplots(1, 1)
gdf.plot('wse', ax=ax, legend=True, cmap='cividis')
<Axes: >