Subset SWOT LR L3 Unsmoothed
This notebooks explains how to retrieve a geographical subset of unsmoothed (250-m) SWOT LR L3 data on AVISO’s THREDDS Data Server.
L3 Unsmoothed data can be explored at:
You need to have xarray, numpy, pydap, threddsclient and matplotlib+cartopy (for visualisation) packages installed in your Python environment for this notebook to work.
Warning
A new version is available for L3 Unsmoothed data: v1.0.1
Note
For now, only 1-day orbit (CalVal) data is available.
Tutorial Objectives
Request Aviso’s Thredds Data Server catalogue to find unsmoothed products
Define a geographical area and temporal period to subset data
Download data locally and visualise it
Import + code
[ ]:
# Install Cartopy with mamba to avoid discrepancies
# ! mamba install -q -c conda-forge cartopy
[1]:
import warnings
warnings.filterwarnings('ignore')
[20]:
import os
from getpass import getpass
import threddsclient
import numpy as np
import xarray as xr
from xarray.backends import PydapDataStore
import requests as rq
import cartopy.crs as ccrs
import matplotlib.pyplot as plt
[3]:
def retrieve_matching_datasets(url_catalogue, cycle_min, cycle_max, half_orbits):
    """ Returns the list of datasets available in the catalogue, matching required half_orbits and cycles range.
    Args:
        url_catalogue
        cycle_min
        cycle_max
        half_orbits

    Returns:
        The list of matching dataset nodes.
    """
    return list(filter(
        lambda dataset: (
            int(dataset.name[30:33]) in half_orbits and
            int(dataset.name[26:29]) >= cycle_min and
            int(dataset.name[26:29]) <= cycle_max),
        threddsclient.crawl(url_catalogue, depth=2)))

def open_dataset(dataset_url):
    """ Open the dataset at dataset_url.
    Args:
        dataset_url

    Returns:
        xr.Dataset
    """
    session = rq.Session()
    session.auth = (username, password)
    store = PydapDataStore.open(dataset_url, session=session, timeout=300, user_charset='UTF-8')
    return xr.open_dataset(store)

def _open_dataset_coords(dataset_url):
    positions_url = dataset_url + '?' + ','.join(["latitude", "longitude", "latitude", "longitude"])
    ds_coords = open_dataset(positions_url)
    return ds_coords

def _get_indexes(ds, lon_range, lat_range):
    mask_left = ((ds["longitude"] >= lon_range[0]) & (ds["longitude"] <= lon_range[1]) &
    (ds["latitude"] >= lat_range[0]) & (ds["latitude"] <= lat_range[1]))

    mask_right = ((ds["longitude"] >= lon_range[0]) & (ds["longitude"] <= lon_range[1]) &
    (ds["latitude"] >= lat_range[0]) & (ds["latitude"] <= lat_range[1]))

    mask = (mask_left | mask_right).any('num_pixels')

    return np.where(mask)[0][0], np.where(mask)[0][-1]

def _output_dir_prompt():
    answer = input('Do you want to write results to Netcdf files? [y/n]')
    if not answer or answer[0].lower() != 'y':
        return None
    return input('Enter existing directory:')

def load_subsets(matching_datasets, variables, lon_range, lat_range, output_dir=None):
    """ Loads subsets with variables and lon/lat range, and eventually write them to disk.
    Args:
        matching_datasets : the datasets nodes in the catalogue
        variables : the variables names
        lon_range : the longitude range
        lat_range : the latitude range
        output_dir : the output directory to write the datasets in separated netcdf files

    Returns:
        xr.Dataset
    """
    if not output_dir:
        output_dir = _output_dir_prompt()
    return [dataset for dataset in [_load_subset(dataset, variables, lon_range, lat_range, output_dir) for dataset in matching_datasets] if dataset is not None]

def _load_subset(dataset_node, variables, lon_range, lat_range, output_dir=None):
    if output_dir:
        output_file = os.path.join(output_dir, f"subset_{dataset_node.name}")
        if os.path.exists(output_file):
            print(f"Subset {dataset_node.name} already exists. Reading it...")
            return xr.open_dataset(output_file)

    # Open the dataset only with coordinates
    dataset_url = dataset_node.opendap_url()
    ds_positions = _open_dataset_coords(dataset_url)

    # Locate indexes of lines matching with the required geographical area
    try:
        idx_first, idx_last = _get_indexes(ds_positions, lon_range, lat_range)
    except IndexError:
        print(f'No pass intersection with selected area for dataset {dataset_node.name}')
        return None

    print(f"Indices for dataset {dataset_node.name}: ({idx_first}, {idx_last})")

    # Download subset
    dataset = open_dataset(dataset_url)

    ds = xr.merge([dataset[var][idx_first:idx_last] for var in variables])
    ds.load()
    print(f"{dataset_node.name} subset loaded.")

    if output_file:
        ds.to_netcdf(output_file)
        print(f"{output_file} created.")

    return ds
Parameters
Data parameters
Variables available in unsmoothed Swot LR L3 data are: * time * calibration * dac * mdt * mss * ocean_tide * quality_flag * sigma0 * ssha * ssha_noiseless * ssha_unedited * ugos * ugosa * vgos * vgosa
Define the variables you want:
[4]:
variables = ['time', 'sigma0', 'ssha_noiseless', 'quality_flag']
OPTIONAL Define existing output folder to save results:
[5]:
output_dir = "downloads"#or None
Define the parameters needed to retrieve data:
geographical area
phase: 1day-orbit (Calval) / 21day-orbit (Science)
cycle min, max
list of half-orbits
Note
Passes matching a geographical area and period can be found using Search Swot tool
[6]:
# Mediterranean sea
lat_range = 25, 50
lon_range = -15, 40

#phase, cycle_min, cycle_max = "calval", 400, 600
phase, cycle_min, cycle_max = "calval", 521, 521

url_catalogue="https://tds.aviso.altimetry.fr/thredds/catalog/dataset-l3-swot-karin-nadir-pre-validated/l3_lr_ssh/v1_0_1/Unsmoothed/catalog.html"
half_orbits = [1, 3, 14, 16]
Authentication parameters
Enter your AVISO+ credentials
[7]:
username = input("Enter username:")
Enter username: aviso-swot@altimetry.fr
[11]:
password = getpass(f"Enter password for {username}:")
Enter password for aviso-swot@altimetry.fr: ········
Area extraction
Gather datasets in the provided catalogue, matching the required cycles and half_orbits
[12]:
matching_datasets = retrieve_matching_datasets(url_catalogue, cycle_min, cycle_max, half_orbits)
'num datasets =', len(matching_datasets)
[12]:
('num datasets =', 4)
[13]:
matching_datasets
[13]:
[<Node name: SWOT_L3_LR_SSH_Unsmoothed_521_016_20230515T032809_20230515T041914_v1.0.1.nc, content type: application/netcdf>,
 <Node name: SWOT_L3_LR_SSH_Unsmoothed_521_014_20230515T014558_20230515T023621_v1.0.1.nc, content type: application/netcdf>,
 <Node name: SWOT_L3_LR_SSH_Unsmoothed_521_003_20230514T162355_20230514T171501_v1.0.1.nc, content type: application/netcdf>,
 <Node name: SWOT_L3_LR_SSH_Unsmoothed_521_001_20230514T144144_20230514T153250_v1.0.1.nc, content type: application/netcdf>]
Subset data in the required geographical area
Warning
This operation takes some time : for each dataset, it downloads coordinates, calculates indices, loads subset and eventually writes it to netcdf file.
Set output_dir to None if you don’t want to write subsets in netcdf files.
[14]:
datasets_subsets = load_subsets(matching_datasets, variables, lon_range, lat_range, output_dir)
Indices for dataset SWOT_L3_LR_SSH_Unsmoothed_521_016_20230515T032809_20230515T041914_v1.0.1.nc: (18377, 29305)
SWOT_L3_LR_SSH_Unsmoothed_521_016_20230515T032809_20230515T041914_v1.0.1.nc subset loaded.
downloads/subset_SWOT_L3_LR_SSH_Unsmoothed_521_016_20230515T032809_20230515T041914_v1.0.1.nc created.
Indices for dataset SWOT_L3_LR_SSH_Unsmoothed_521_014_20230515T014558_20230515T023621_v1.0.1.nc: (17503, 29584)
SWOT_L3_LR_SSH_Unsmoothed_521_014_20230515T014558_20230515T023621_v1.0.1.nc subset loaded.
downloads/subset_SWOT_L3_LR_SSH_Unsmoothed_521_014_20230515T014558_20230515T023621_v1.0.1.nc created.
Indices for dataset SWOT_L3_LR_SSH_Unsmoothed_521_003_20230514T162355_20230514T171501_v1.0.1.nc: (52667, 64751)
SWOT_L3_LR_SSH_Unsmoothed_521_003_20230514T162355_20230514T171501_v1.0.1.nc subset loaded.
downloads/subset_SWOT_L3_LR_SSH_Unsmoothed_521_003_20230514T162355_20230514T171501_v1.0.1.nc created.
Indices for dataset SWOT_L3_LR_SSH_Unsmoothed_521_001_20230514T144144_20230514T153250_v1.0.1.nc: (52694, 64774)
SWOT_L3_LR_SSH_Unsmoothed_521_001_20230514T144144_20230514T153250_v1.0.1.nc subset loaded.
downloads/subset_SWOT_L3_LR_SSH_Unsmoothed_521_001_20230514T144144_20230514T153250_v1.0.1.nc created.
[15]:
ds = datasets_subsets[0]
ds
[15]:
<xarray.Dataset>
Dimensions:         (num_lines: 10928, num_pixels: 519)
Coordinates:
    latitude        (num_lines, num_pixels) float64 47.94 47.94 ... 24.8 24.8
    longitude       (num_lines, num_pixels) float64 0.00777 0.00455 ... 4.971
Dimensions without coordinates: num_lines, num_pixels
Data variables:
    time            (num_lines) datetime64[ns] 2023-05-15T03:39:44.087772672 ...
    sigma0          (num_lines, num_pixels) float64 nan nan nan ... nan nan nan
    ssha_noiseless  (num_lines, num_pixels) float64 nan nan nan ... nan nan nan
    quality_flag    (num_lines, num_pixels) float32 102.0 102.0 ... 102.0 102.0
Attributes:
    comment:             Time of measurement in seconds in the UTC time scale...
    leap_second:         0000-00-00T00:00:00Z
    long_name:           time in UTC
    standard_name:       time
    tai_utc_difference:  37.0
_ChunkSizes: 82107Basic manipulations
Concatenate subsets
ds = xr.concat(datasets_subsets, dim='num_lines') dsVisualize data
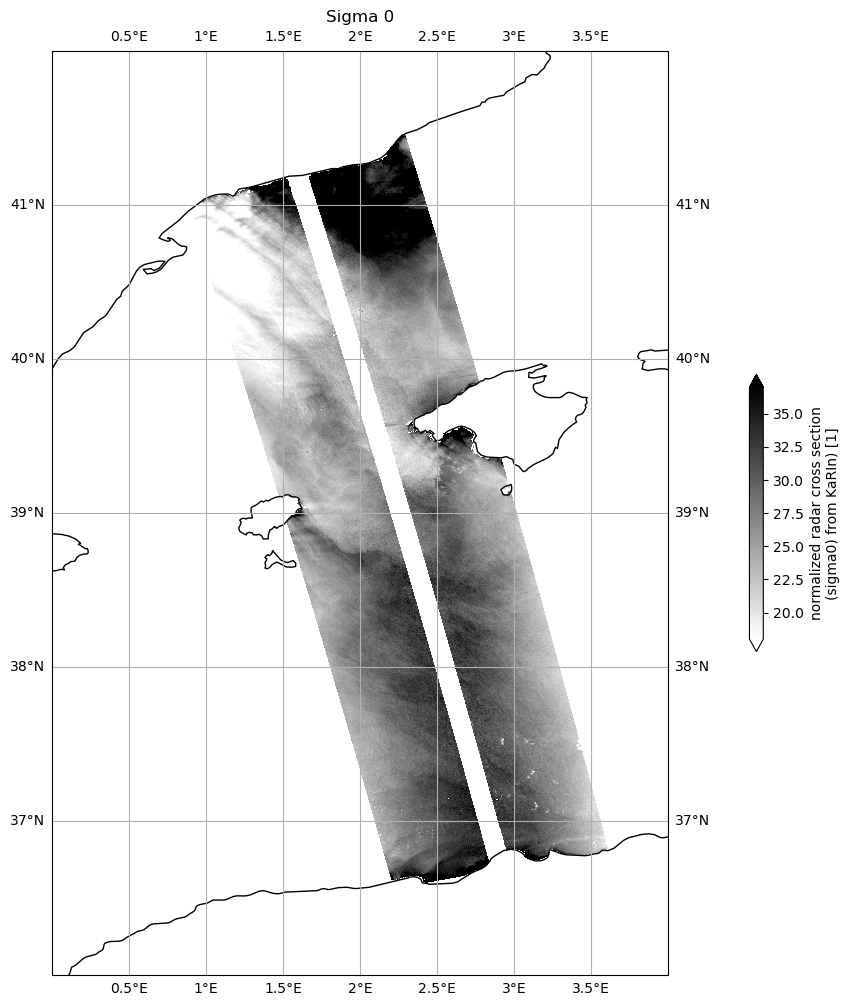
Apply quality flag on Sigma 0
[16]:
ds["sigma0"] = ds.sigma0.where(ds.quality_flag==0)
[24]:
plot_kwargs = dict(
    x="longitude",
    y="latitude",
    cmap="gray_r",
    vmin=18,
    vmax=37,
)

fig, ax = plt.subplots(figsize=(21, 12), subplot_kw=dict(projection=ccrs.PlateCarree()))

ds.sigma0.plot.pcolormesh(ax=ax, cbar_kwargs={"shrink": 0.3}, **plot_kwargs)
plt.title("Sigma 0")

ax.gridlines(draw_labels=True)
ax.coastlines()
ax.set_extent([0, 4, 36, 42], crs=ccrs.PlateCarree())
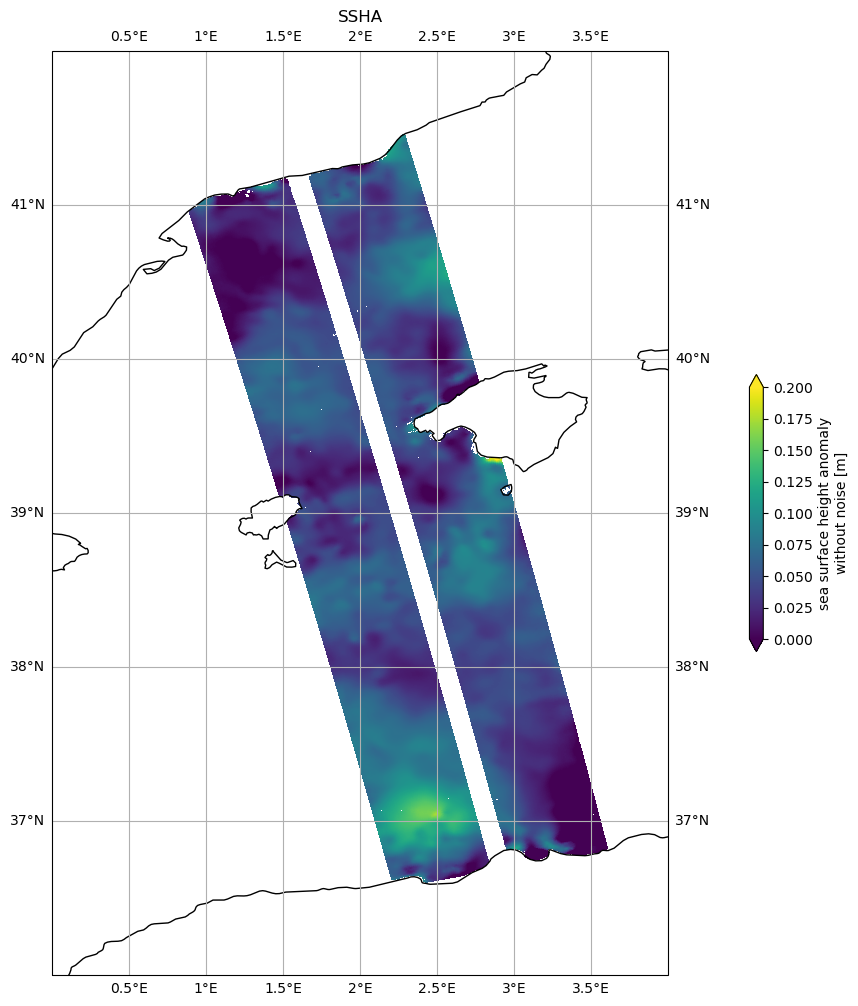
[25]:
plot_kwargs = dict(
    x="longitude",
    y="latitude",
    vmin=0,
    vmax=0.2,
)

fig, ax = plt.subplots(figsize=(21, 12), subplot_kw=dict(projection=ccrs.PlateCarree()))

ds.ssha_noiseless.plot.pcolormesh(ax=ax, cbar_kwargs={"shrink": 0.3}, **plot_kwargs)
plt.title('SSHA')

ax.gridlines(draw_labels=True)
ax.coastlines()
ax.set_extent([0, 4, 36, 42], crs=ccrs.PlateCarree())
[ ]: